
With Oregon being such a volatile weather climate with constantly changing conditions from safe to hazardous, it’s a good idea to have a plethora of information right at your finger tips.
Here I have cataloged the best possible weather maps for you from Doppler to infrared and lightning maps.
Be sure to bookmark this page and check back often for current weather conditions and alerts.
Live Animated Weather Maps
US Radar Map – This animated map covers the entire United States but you can click any region to get a more detailed close up of current conditions in your hood.
Pacific Ocean Satellite Maps – These live animated satellite loop shows you the entire West Coast Pacific Ocean and gives you an idea of what’s heading our way.
West Coast Cloud Cover – This map shows the entire United States West Coast live satellite cloud cover in an animated loop. It also covers the Pacific Ocean.
Absolute Coolest Maps
Global Wind Speeds – Here are the global surface wind speeds as of right now. This map is so powerful. I will drop a few links here with different options but if you click the word “Earth” in the lower left, you can change the data yourself.
NEW Global Wind Speeds Map – This is the new updated global wind speeds map which includes precipitation and pressure systems. Click the option in the bottom right of the window.
Carbon Monoxide Surface Concentration – A great way to track forest fire smoke.
Sulfur Dioxide Surface Mass – The air is cleaner up here than most major US Cities.
Ocean Currents – Pretty neat huh? Sea Surface Temperature Anomaly – Here you can see El Nino brewing in the Pacific as well as “the blob” of the coast of Oregon. As of Feb 2016 NASA says the blob has finally broken up after El Nino.
Hurricane Tracker – I know this is East Coast but it sure is cool.
Don’t forget to share this article!
Weather Forecast and History
Personal Weather Station yes, you can buy one on Amazon! I have 3. One in my room, one in my kitchen and one in the garage.
Live Weather Forecast – I find This to be the best forecast, easiest to read, most accurate and most updated. They update often and even have a great app for your phone which I do use. You can click on “change station” and pick one closer to you. I did Pearl District because it is downtown in the middle of Portland.
Monthly Forecast and Past – This site seems to be the best at showing a month long outlook and recording past weather. You can go back to any month and see what the actual temperature was. The only problem with this site is the month long is not too accurate, but what can you expect from such a random ever changing thing.
Live Information!
Check Power Outages – A PGE(Portland General Electric) page to check for power outage sin your area.
Oregon River Levels – Check your local river, creek or stream to see if it’s nearing flood levels.
Live Lightening Maps
It’s really hard to pick just one here so I am giving you multiple options.
Map 1 – This is probably my favorite lightening map because of the live strike data.
Map 2 – A new one.
Earthquake Maps
Just One – Well, not like we really have to worry about this here very often. However you should always be prepared for the Cascadia Mega Quake.
Earth Quake Alert App – This Red Cross app is neat and allows you to get alert notifications for multiple areas. For instance, I have one set up for the Bay Area where I moved from and one for Portland and Seattle.
Video by NASA – The EPIC Sun, a MUST watch.
More amazing links.
Amazing Data Maps From NASA
In this section, we cover some of our ever changing planet and data recorded by new NASA Satellite Missions.
NASA Nitrogen Dioxide Levels 2005-2011 [Animated Map]
Here NASA shows how levels of Nitrogen Dioxide have been slowly decreasing over the United States for many years. The reduction in air pollution is attributed to stricter car regulations and an increase of hybrid and electric cars on the road. You can also see a reduced amount of carbon monoxide world wide in this 14 year span. My theory is because the magnetic field is weakening and there are holes in the ozone layer the pollution is just seeping out into space. I’m kidding, just made that up but wouldn’t that be funny. You heard it here first!
NASA Carbon Dioxide vs Vegetation [Animated Map]
Here you can see the Earth “breathing”. The yellow signifies carbon dioxide levels while the green signifies ground vegetation. This animation is over the course of a year. I do not know what year but estimated 2010+. As you can see in the Winter when plant life dies off and humans use more natural resources for heating, the cloud of funk takes over. However, as Spring and early Summer comes and the plant life thrives and naturally filters out the air for us. This data is collected by NASA’s Aqua Satellite using the AIRS(Atmospheric Infrared Sounder) Instrument. For a live map and explanation watch this video.
Highly Recommended YouTube Channels To Follow
NASA Goddard Official – This is a great channel and you can expect videos like this. Neat right?
NASA Jet Propulsion Laboratory – Need I say more?
Suspicious Observers – One of my favorites and an amazing channel that covers the sun, daily solar reports, space weather and more. The earth’s magnetic field, historic weather patterns, earthquakes, and more. I make sure to watch every single episode and I even pay the $20 a year to subscribe to his website where he offers many more “Deeper Look” videos.
Adapt 3030 – Be ready for the oncoming Ice Age. This is a great channel to follow that covers world wide weather the media chooses to ignore. All you hear about is warming but not the insane cold records and snow levels and so on being smashed daily. See the other side and wonder what’s really going on. A great channel to throw into your watch list.
Dutchsinse – A Weekly Earthquake and Volcanic activity summary channel with a lot of neat information. You will learn a lot about the planets activity and movement by following this channel.
Note, I did not take this photo of a sinkhole in Gresham. It was floating around the internet and I just decided to add Godzilla to it.
I did not take this photo, it is floating around the webs. I just added our local hero Darth Vader to it for laughs.
One more sinkhole!
Ohhhh yeah!
I will update this as time goes on and new information is available and so on.
Please share!
⛄️☃️❄️ I want some snow on Christmas Day
It’s been a long time since I’ve been to Seattle. They had an unbelievable snow storm recently, did you see that? My brother has been there for a couple years and he said it was the most snow he’s ever seen. I hope you all are staying warm :)
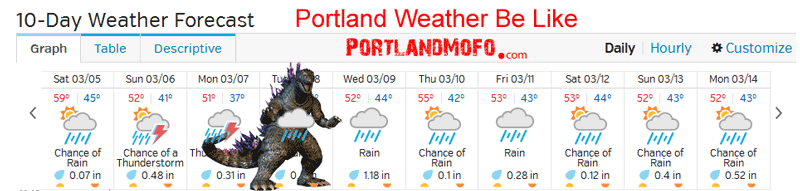
What a great city Seattle is. The snow up there was crazy a couple weeks ago! 2 to 3 feet in some areas from what I understand. Crazy! I’m glad spring is right around the corner.